Media Matters goes beyond simply reporting on current trends and hot topics to get to the heart of media, advertising and marketing issues with insightful analyses and critiques that help create a perspective on industry buzz throughout the year. It's a must-read supplement to our research annuals.
Sign up now to subscribe or access the Archives
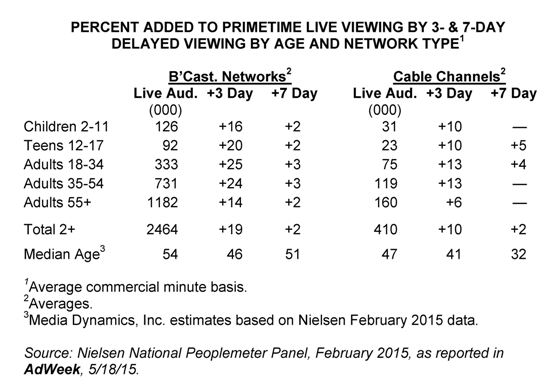
According to Nielsen's February 2015 tally of primetime commercial minute viewing, the inclusion of 3- and 7-day delayed viewing by broadcast TV networks added significantly to their "live" audiences, averaging a 21% increase when the time frame was extended to 7 days. In contrast, a typical cable channel added only 12% to its live viewership through delayed exposures. In both cases, the vast majority of the audience boost (85-90%) occurred within the first 3 days.
The attached table presents tabulations we made based on Nielsen data published by AdWeek, indicating the size of the average minute live audience for the broadcast networks and cable channels, and the percent added by 3- to 7-day delayed viewing for various age breaks. As shown, the largest additions for the broadcast network occur in the 12-54 age range whereas cable's increments are largest among adults 18-54.
We also estimated the median ages of the live and time-shifted audiences. We found that the median age of the broadcast networks' (including Fox and the WB) live viewers was 54 years, but the average 3-day delayed audience was considerably younger (46 years). Similar results were evident for the cable channels, which on average attracted a considerably younger audience than the broadcast networks.
Looking at these statistics, which do not include commercial zapping, it is clear why the broadcast networks were so keen to move their rating currency from live/same day to C-3, a shift that was accomplished some seasons ago. However, the relatively minor additional audience accrued with the inclusion of days 4-7 (2%), although being incorporated into some of the upfront buys, may not be worth the trouble. There are signs that the networks may be backing off, preferring instead to monetize viewers attained via other platforms (out-of-home and digital), as these gains may be more substantial and an easier sell to the buyers. The problem here is finding a reliable way to measure such audiences, one that is compatible with the in-home peoplemeter system. So far, we remain unconvinced that such systems have been properly developed and validated.
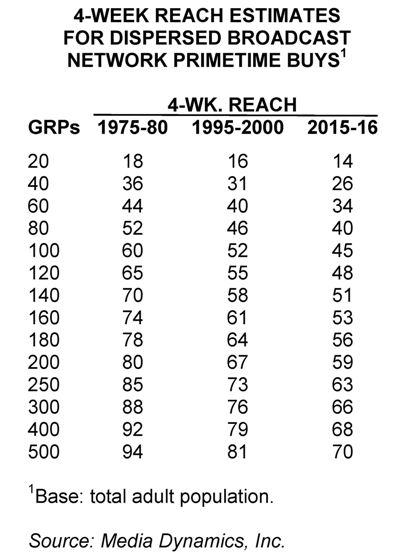
Way back in the pre-cable days, when the three broadcast TV networks routinely drew 85-90% of the viewers in those time periods where they offered national TV fare, it was pretty easy to attain significant reach levels over a four-week time frame using only broadcast network buys. This was particularly true in primetime, a daypart where almost everyone watched to some extent and one that was totally dominated by ABC, CBS and NBC.
Times, however, have changed but the reach tables used by media planners in evaluating various TV buying options and combinations thereof have not. From time to time Nielsen provides a review of the reach attained by sample schedules at varying GRP weights and these tabulations, along with other data, are used to update the standard reach tables used by media planners; however, many of the tables now utilized seem to be way out of date, reflecting a situation that prevailed 10-15 years ago. The full effects of today's rating fragmentation and rising "reach ceilings" present quite a different picture.
To illustrate this, we have culled our own past experiences with primetime broadcast TV network reach curves, starting with the 1975-80 pre-cable period, then updated to 1995-2000 and finally, our latest, just updated estimates. These comparisons are summarized in the accompanying table, which shows four-week reach attainment for primetime broadcast TV network schedules, assuming reasonably dispersed buys. In the 1975-80 period, the broadcast networks attained upwards of 90% of all viewing, 100 adult GRPs produced a 60% reach, and 500 GRPs elevated reach to the 94% mark. By 1995-2000, the corresponding reach levels at the same GRPs were only 52% and 81%, respectively; and currently, even with five, not three broadcast networks, a buy of 100 GRPs yields only a 45% reach while 500 GRPs raises this to 70% (see table).
A number of factors account for the decline in broadcast network reach capabilities. For one thing, average minute adult ratings, which were about 10-11% in 1975-80, have declined to only 3% currently. In addition, where almost everybody (typically 90-95%) sampled one or more primetime network shows in a single week, now upwards of 30% do not do so. In short, the "reach ceiling" for primetime network fare has altered dramatically in recent years, as more and more viewers opt for cable or SVOD fare like Netflix or Hulu. Finally, the switch to commercial minute ratings from all-content ratings adds a new dimension, as some people are chronic ad-avoiders and use their DVR to opt out of the audience, even though they continue to watch program content.